Customer Churn Analysis & Segmentation
Why do customers leave — and who is most at risk right now? This end-to-end project answers both questions using machine learning and RFM segmentation, turning raw e-commerce data into a clear, actionable retention playbook.
The Problem
The business had no systematic way to identify which customers were drifting toward churn or to distinguish loyal customers from one-time buyers — making retention efforts scattershot and expensive.
My Approach
Combined RFM feature engineering with a logistic regression churn model optimised for recall. K-Means clustering grouped customers into actionable segments — loyal, at-risk, inactive — surfaced through an interactive dashboard.
Key Outcomes
- High-recall churn model ensuring at-risk customers are never missed
- Inactivity & refund behaviour identified as strongest churn signals
- 5 distinct segments enabling targeted, cost-efficient retention campaigns
- Dashboard connecting each insight directly to a recommended action
Tech Stack

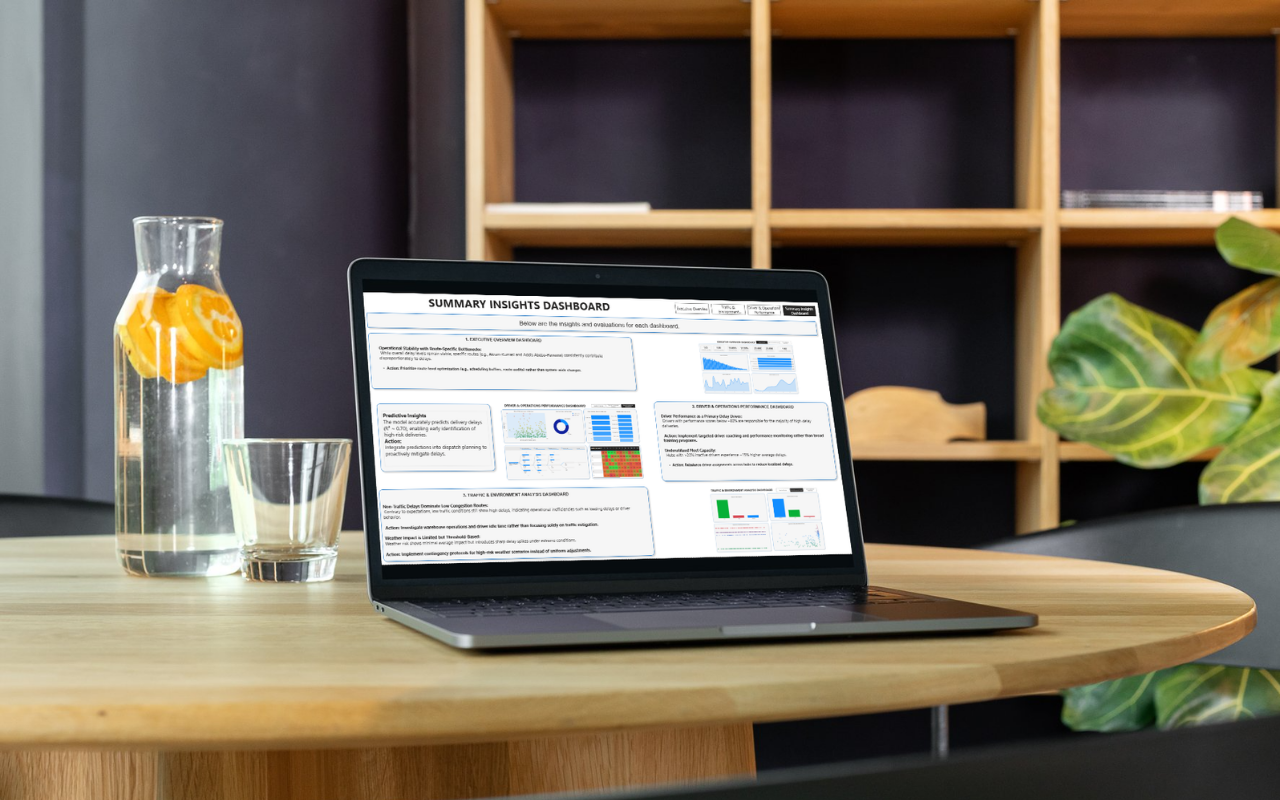
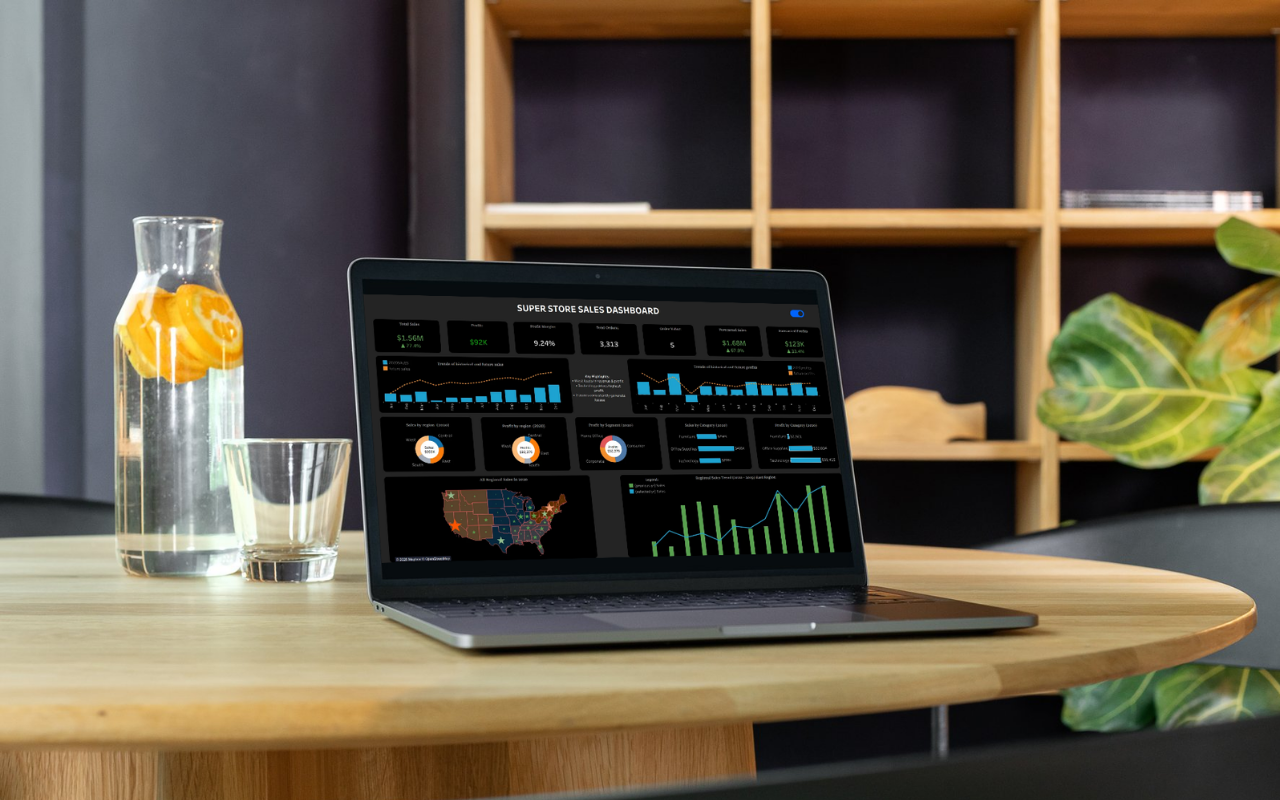
Interactive Dashboard
Open in Tableau Desktop or the free Tableau Public Desktop to explore segment views, churn breakdown, and every filter.
Download Dashboard (.twb)Free viewer: Tableau Public Desktop
Input a customer's RFM profile and get an instant churn probability score, customer segment label, and a recommended retention action — powered by the model trained in this project.